
Data Repository of Aurora Imaging Spectroscopy (DRAIS)
Hyper Spectral Camera for Auroral Imaging (HySCAI) data is made available through the HySCAI data repository at the National Institute for Fusion Science (NIFS), National Institutes of Natural Sciences (NINS), Japan.
To ensure that HySCAI data is used effectively and accurately by the community, we encourage everyone to read the following rules of data use before you access to the data or software in this repository site.
Rules of data use
- Users should contact the PI of this project (Katsumi Ida, aurora.project@nifs.ac.jp) before using the repository data for their data analysis to consult on the appropriate use of instrument data and always use the latest version of the data file. Redistribution of the data file is strictly prohibited.
- Users should provide the PI of this project a copy of the manuscript or presentation that uses this data repository enough before submitting that manuscript for consideration of publication or the presentation at a conference or workshop so that sufficient time is available to get necessary comment back to the data user. PI would suggest potential coauthor(s) from this project to be invited.
- Publications that use this data repository must cite the following paper as reference and include the following statement in the Data Availability statement or Acknowledgements section.
- Reference: M. Yoshinuma, K. Ida, Y. Ebihara, Earth, Planets and Space (2024), https://doi.org/10.57451/s40623-024-02039-y
- Statement: Science data of the HySCAI / LCF camera / all-sky camera (chose appropriate instruments) were obtained from the Data Repository of Aurora Imaging Spectroscopy (DRAIS) operated by NIFS/NINS (DOI: 10.57451/nifs.aurora-project).
All-sky camera videos (mp4 file) are available
All-sky camera videos (mp4 file) are made available through "Aurora video".
Access to Data files (search by Date)
Please select the range of the date and time (UTC) in the following page. The local time in Kiruna is UTC+1 or UTC+2 (summer time).
The following data on this repository server can be accessed by anyone.
1. HySCAI Data
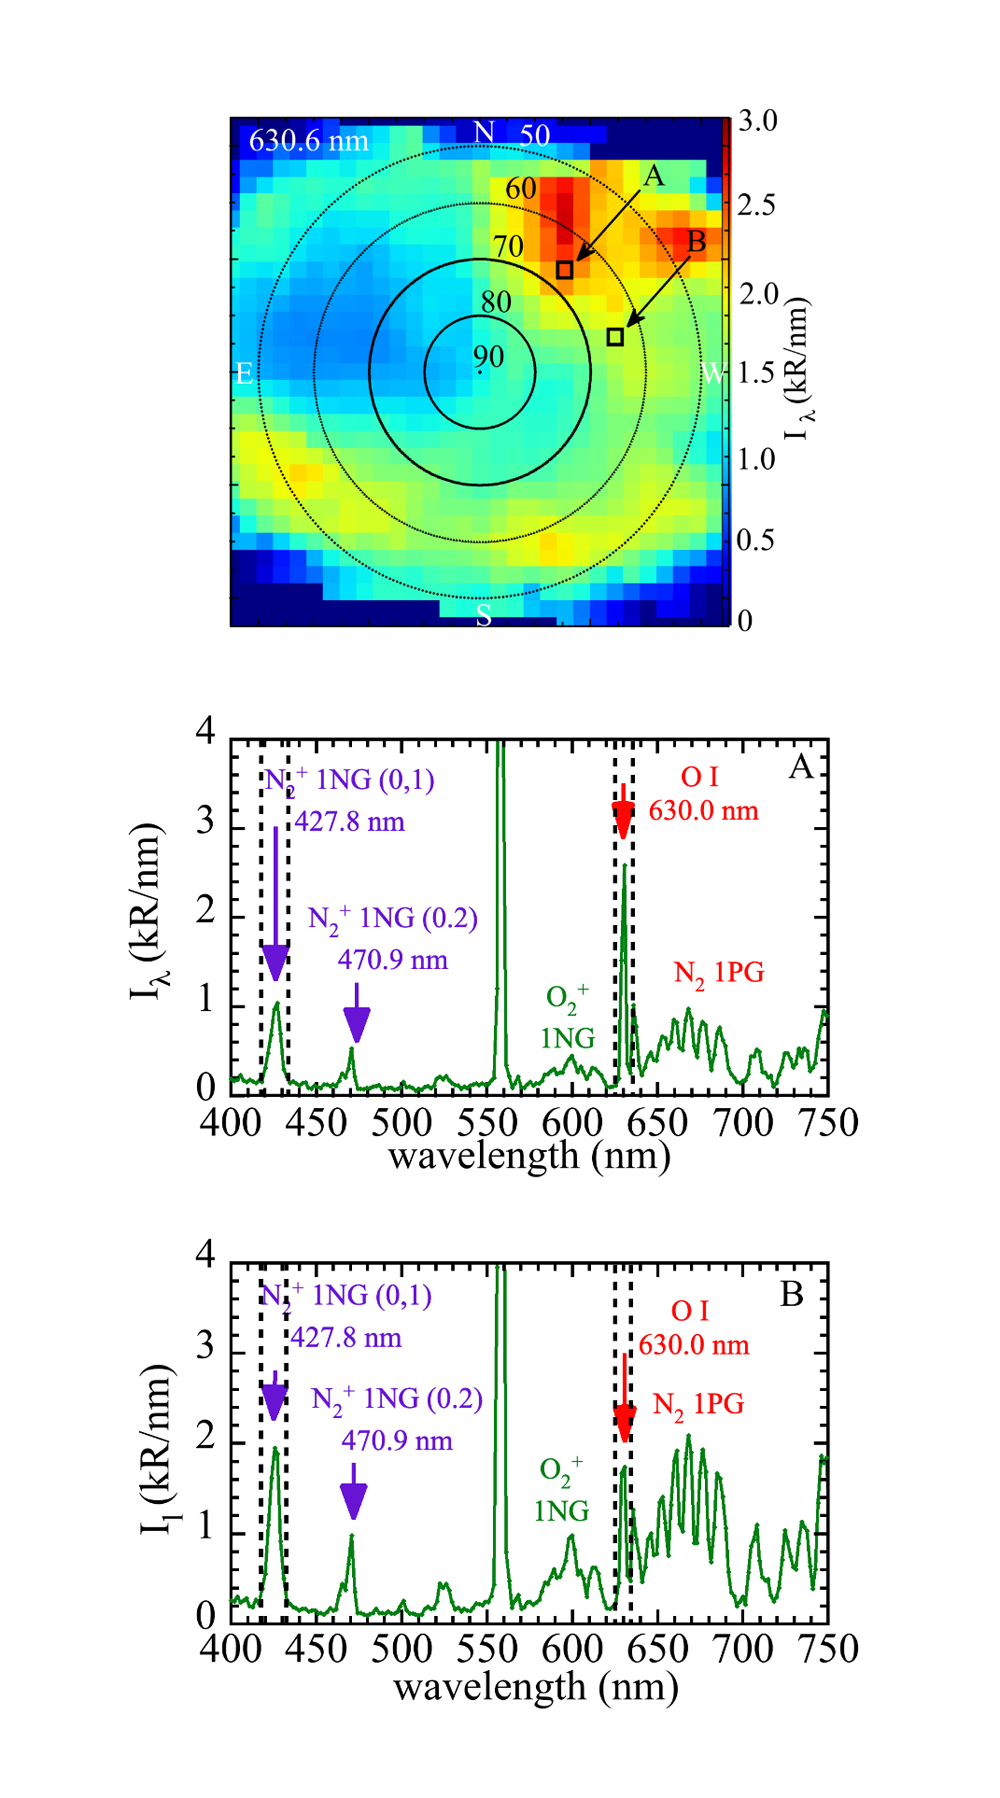
spec2d : spectrum intensity (kR/nm) measured with HySCAI
- Three dimensional data of spectrum intensity, Iλ (w, x, y), with wavelength, azimuth (theta) and inclination angle (phi) at a time slice given by StartTime
- Dimension w is the pixel number.
- Dimension x is the pixel perpendicular to the slit of the spectrometer.
- Dimension y is the pixel parallel to the slit of the spectrometer.
- The spectrum at the specified position (theta, phi) is given in the unit of kR/nm or counts/pixel.
- The data file is available every 1 or 2 minute.
- This is an original source file for spectrum, spectrum_time, mimage, mimage_time files.
- Iλ (w, x, y) dimmed is the intensity without peripheral dimming correction.
- Iλ (w, x, y) is the intensity with peripheral dimming correction.
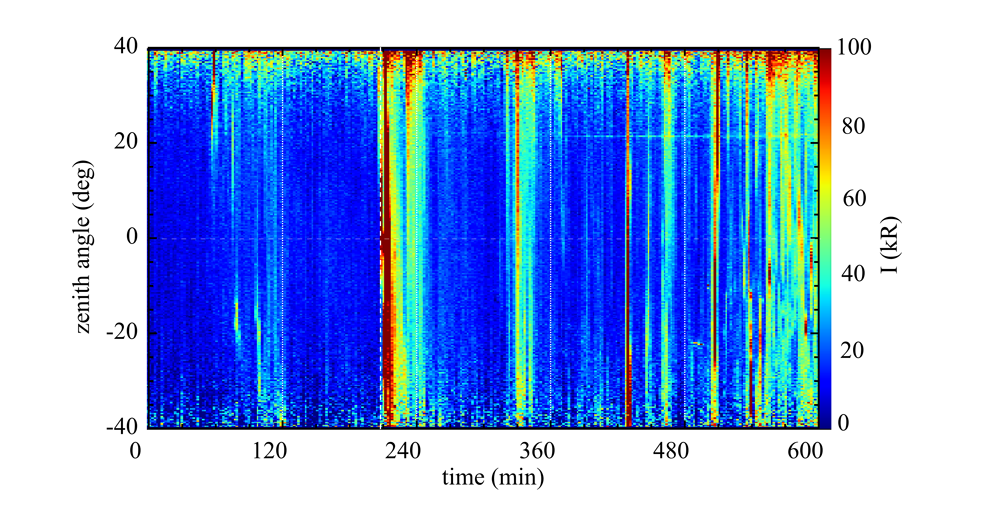
Spec2d_keogram:time evolution of total emission (kR) at S-N direction for one night including next day (starting time is written as file ID)
- Two dimensional data of intensity integrated along wavelength, I (y, t), in the unit of kR.
- Dimension y is the zenith angle at S-N cross section.
- Dimension t is the time in the unit of minute respect to the start time of observation of the night.
- Time stamp of the file is the start time of the observation, which is usually at the evening.
- Only one file for one night.
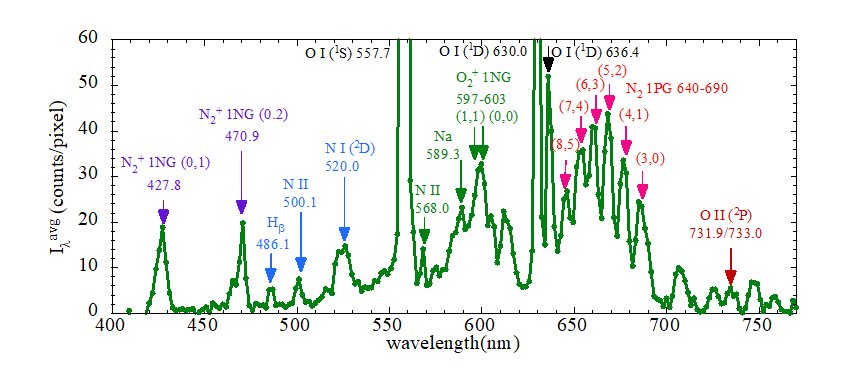
spectrum : spectrum (kR/nm) averaged in space
- One dimensional data of space averaged spectrum intensity, Iλ (w), a time slice given by StartTime in the unit of kR/nm or counts/pixel.
- Dimension w is the wavelength in the unit of nm.
- The file is available every 1 or 2 minute.
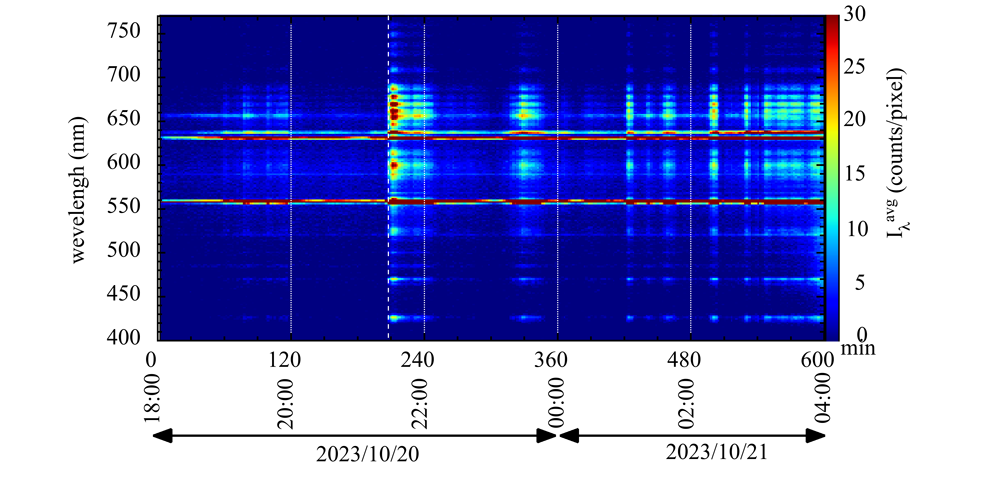
spectrum_time:time evolution of spectrum averaged in space (kR/nm) for one night including next day (starting time is written as file ID)
- Two dimensional data of space averaged spectrum intensity, Iλ (w, t), in the unit of kR/nm or counts/pixel.
- Dimension w is the wavelength in the unit of nm.
- Dimension t is the time in the unit of minute respect to the start time of observation of the night.
- Time stamp of the file is the start time of the observation, which is usually at the evening.
- Only one file for one night.
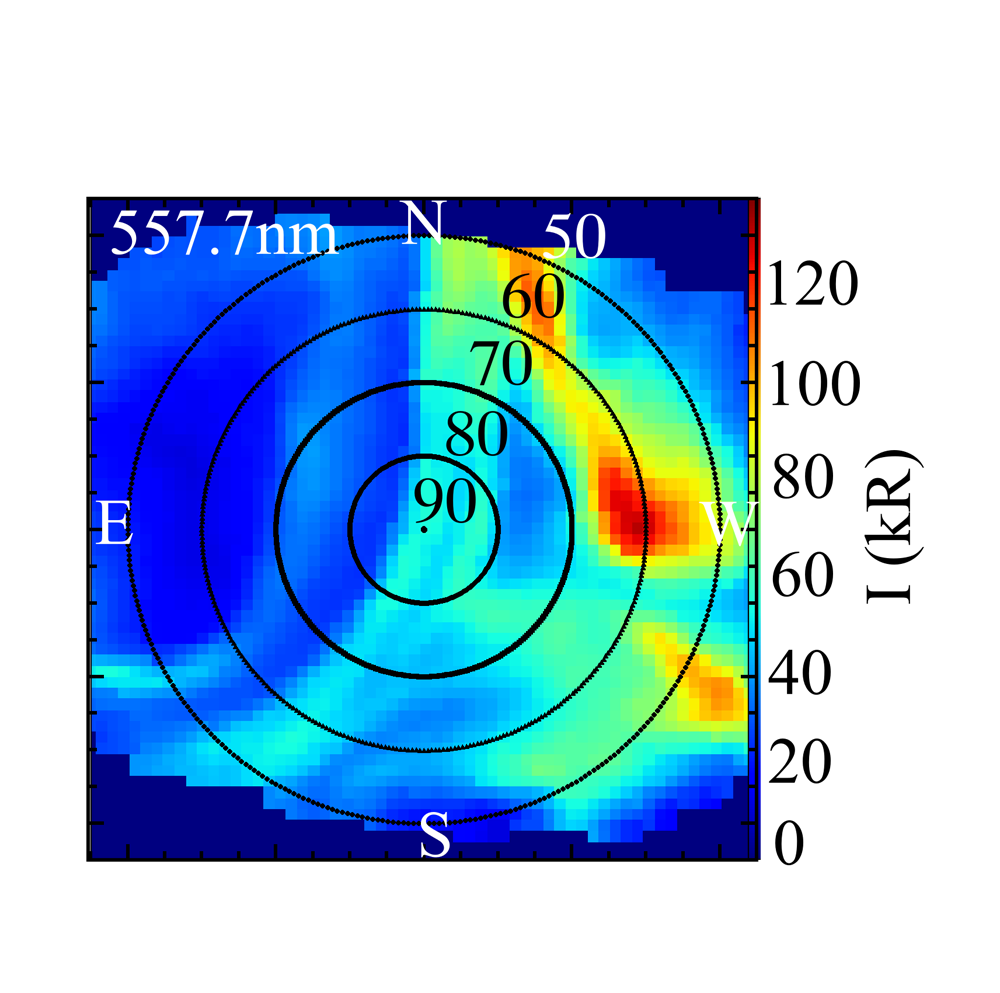
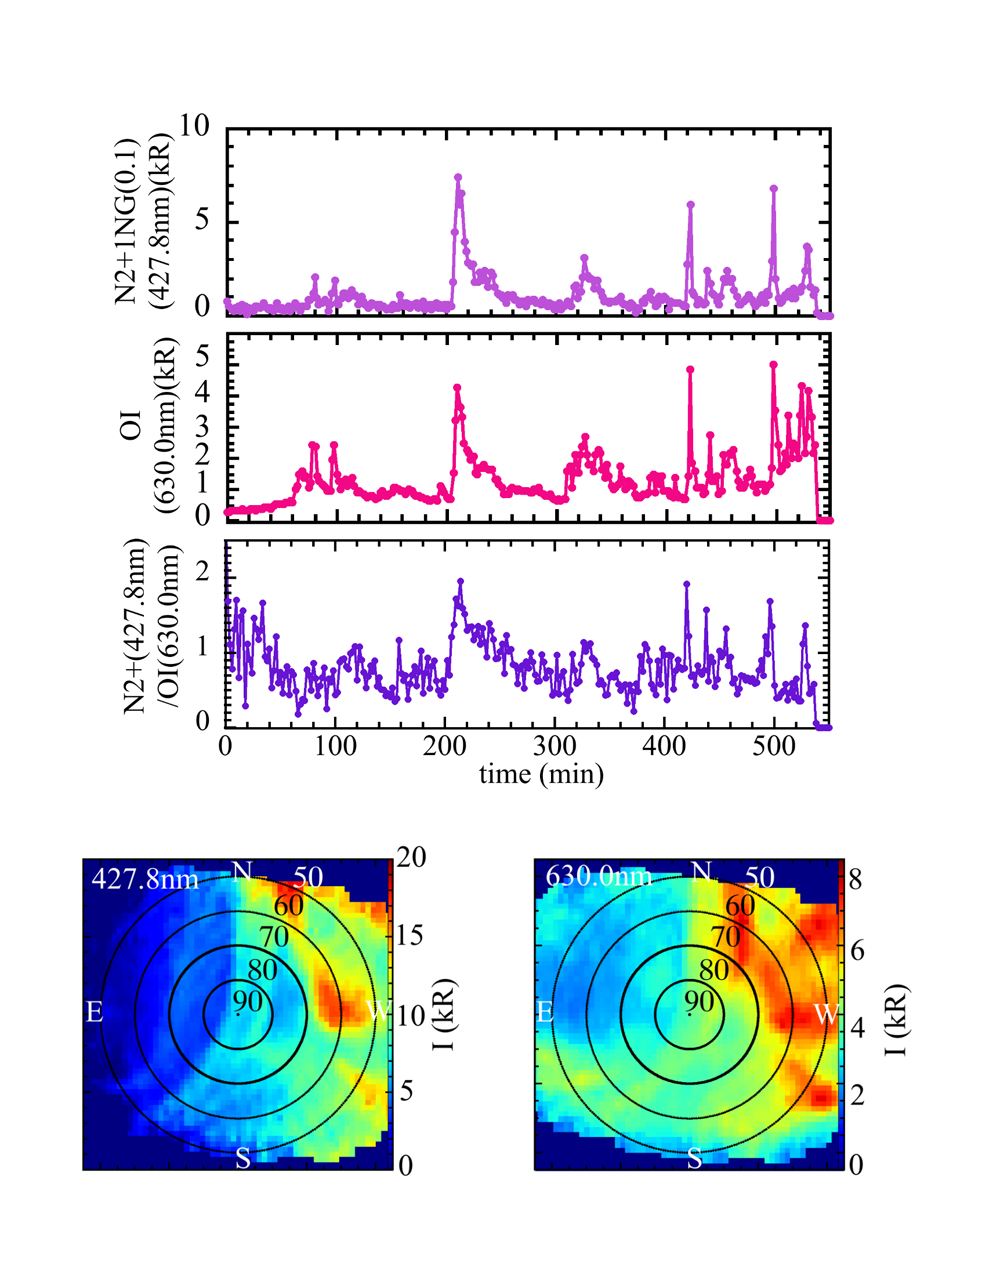
mimage : monochromatic image (kR) integrated on wavelength range.
- Two dimensional data of emission intensity, I (x, y), with azimuth (theta) and inclination angle (phi) data at a time slice given by StartTime in the unit of kR.
- Dimension x is the pixel perpendicular to the slit of the spectrometer.
- Dimension y is the pixel parallel to the slit of the spectrometer.
- Twenty emission line intensity is given by integrating the spectrum numerically within the bandwidth specified.
- The data file is available every 1 or 2 minute.
- I (x, y) dimmed is the intensity without peripheral dimming correction.
- I (x, y) is the intensity with peripheral dimming correction.
mimage_time : time evolution of monochromatic image (kR) for one night including next day (starting time is written as file ID)
- Three dimensional data of emission intensity, I (x, y, t), with azimuth (theta) and inclination angle (phi) data in the unit of kR.
- Dimension x is the pixel perpendicular to the slit of the spectrometer.
- Dimension y is the pixel parallel to the slit of the spectrometer.
- Dimension t is the time in the unit of minute respect to the start time of observation of the night.
- I (x, y) dimmed is the intensity without peripheral dimming correction.
- I (x, y) is the intensity with peripheral dimming correction.
- Time stamp of the file is the start time of the observation, which is usually at the evening.
- Only one file for one night.
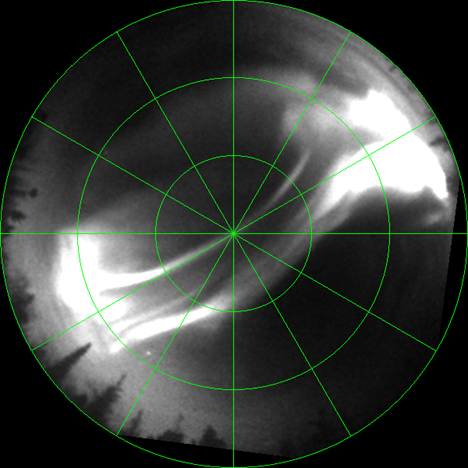
monitor:Position calibrated HySCAI monitor image (RGB)
- Three dimensional RGB data of monitor camera, I (fn, x, y), with azimuth (theta) and inclination angle (phi) data during the scan of HySCAI system.
- Dimension fn is frame number.
- Dimension x is the horizontal pixel of the CCD detector.
- Dimension y is the vertical pixel of the CCD detector.
- The data file is available every 1 or 2 minute.
2. LCF camera Data
Lcfimage : monochromatic image measured with Liquid Crystal Filter.
- Three dimensional intensity data of liquid Crystal Filter (LCF) camera, I (fn, x, y), with azimuth (theta) and inclination angle (phi) data during the scan of HySCAI system.
- Dimension fn is frame number.
- Dimension x is the horizontal pixel of the CCD detector.
- Dimension y is the vertical pixel of the CCD detector.
- The data file is available every 1 or 2 minute.
3. All-sky camera Data
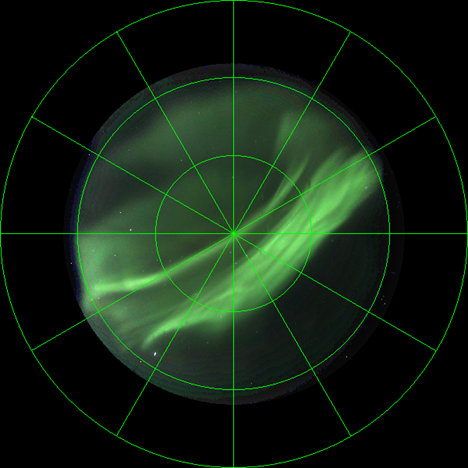
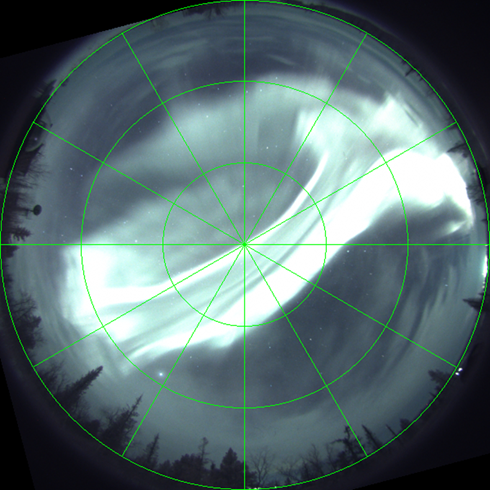
Allsky : Position calibrated all-sky image (RGB).
- Two dimensional RGB data of monitor camera, I (x, y), with azimuth (theta) and inclination angle (phi) data at a time slice given by StartTime.
- Dimension x is the horizontal pixel of the CCD detector.
- Dimension y is the vertical pixel of the CCD detector.
- The data file is available every 11-12 second.
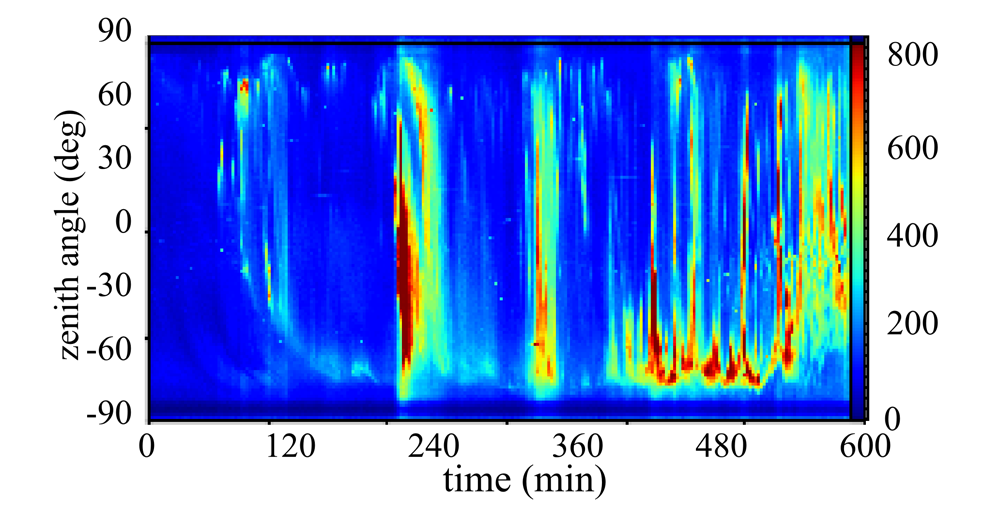
allsky_keogram:time evolution of RGB and total intensity (counts) at S-N direction for one night including next day (starting time is written as file ID)
- Two dimensional data of RGB intensity, IR (y, t), IG (y, t), IG (y, t), and total intensity I (y, t) in the unit of counts.
- Dimension y is the zenith angle at S-N cross section.
- Dimension t is the time in the unit of minute respect to the start time of observation of the night.
- Time stamp of the file is the start time of the observation, which is usually at the evening.
- Only one file for one night.
Data viewer
“myView2” download
“myView2” is a Python script to plot data. Windows python 3.11.5, matplotlib 3.9.0, wxpython 4.2.1 environment. After installing the required modules, Move to the myView2_aurora folder obtained by extracting the zip file and launch myView2.py.
$ pip install numpy scipy matplotlib wxpython pytz
$ cd path/to/myView2_aurora
$ python myView2.py
myView2 download
Access to Data files (search by Date)
Please select the range of the date and time (UTC) in the following page. The local time in Kiruna is UTC+1 or UTC+2 (summer time).